Sigbit takes data visualization to new heights with Orbit
In 2012, the company Significant Bit was founded in Norrköping by two brothers who had previously worked as developers at a large B2B agency. Since then, the innovative company, now known as the slightly shorter SigBit, has grown steadily and has now developed Orbit, a tool that revolutionizes how organizations visualize and interact with their data.
We began our journey with the ambition to fill a gap between regular WordPress agencies and larger consulting firms, says founder Johan André. Our focus is almost exclusively on web applications and helping our clients digitalize their operations.
Orbit is, unsurprisingly, a web-based application that uses a so-called knowledge graph to help organizations see how different data sets relate to each other.
The application can handle any type of data, as long as it’s related. The threshold to get started is quite low, and in some cases, we’ve received an Excel file and done an import, so that the user is ready to explore the graph, says Johan André.
A prominent example of Orbit in use is with Smart Built, a strategic innovation program within urban development. With Orbit, they can visualize investment areas, projects, and relationships between different actors within urban development. The journey with Orbit began with an idea from Eric Holmstedt at Norrköping Science Park.
Eric contacted us, and together we developed the basic concept, says Johan. Over the years, the concept has evolved and gained more features, but the original concept has permeated the development.
As a science park, we are involved in many networks and participate in various contexts, which means we handle a lot of information. Within all this information, opportunities for our companies in the field of visualization also arise. Orbit is one such case where we can give companies in our environment the opportunity to develop existing or new services and products, says Eric Holmstedt, COO at Norrköping Science Park.
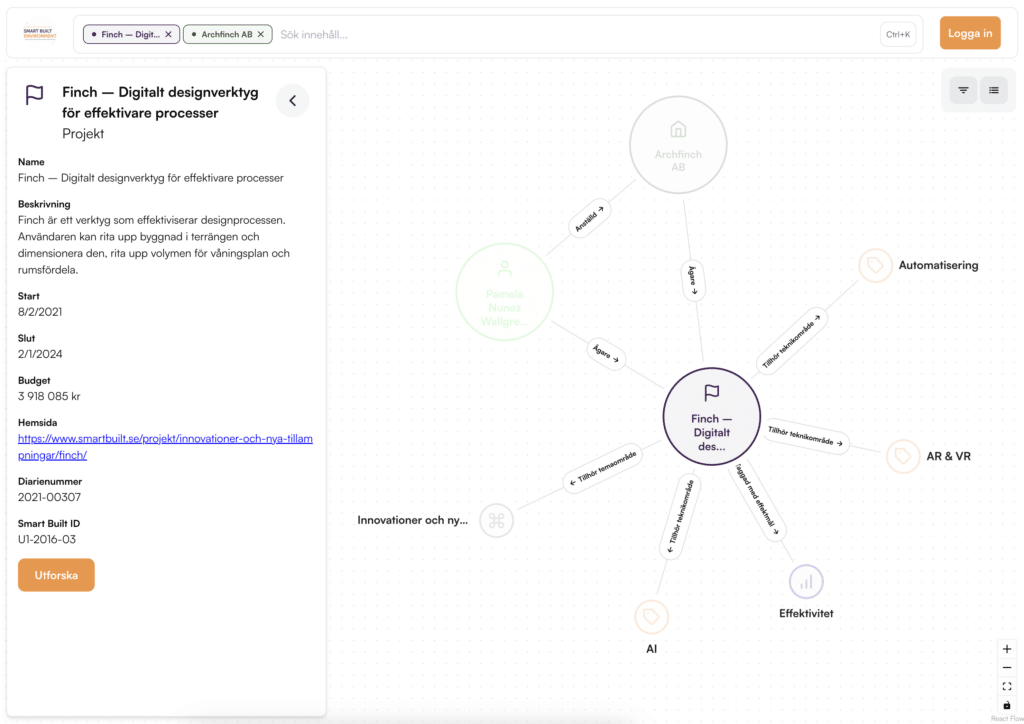
Orbit allows the user to navigate their data in a graph, which is often more visually clear than reading an Excel document – something users find both exciting and useful, says Johan André. I strongly believe in combining different types of visualizations to meet different needs. It’s important to work from a question and know what you want to show.
Sigbit is driven by a strong desire to help its clients solve problems and simplify their operations.
For us, it’s important that we understand the customer and their challenge so that we can deliver the best solution to them. We would rather say no to projects that we don’t believe in because, in the end, the customer will thank us for not wasting their resources, says Johan André.
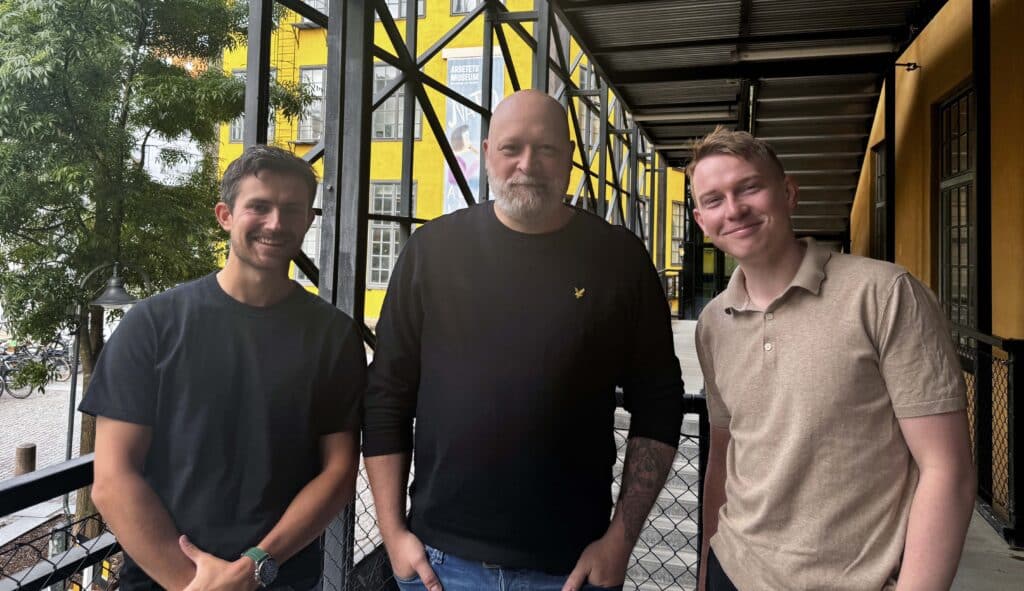
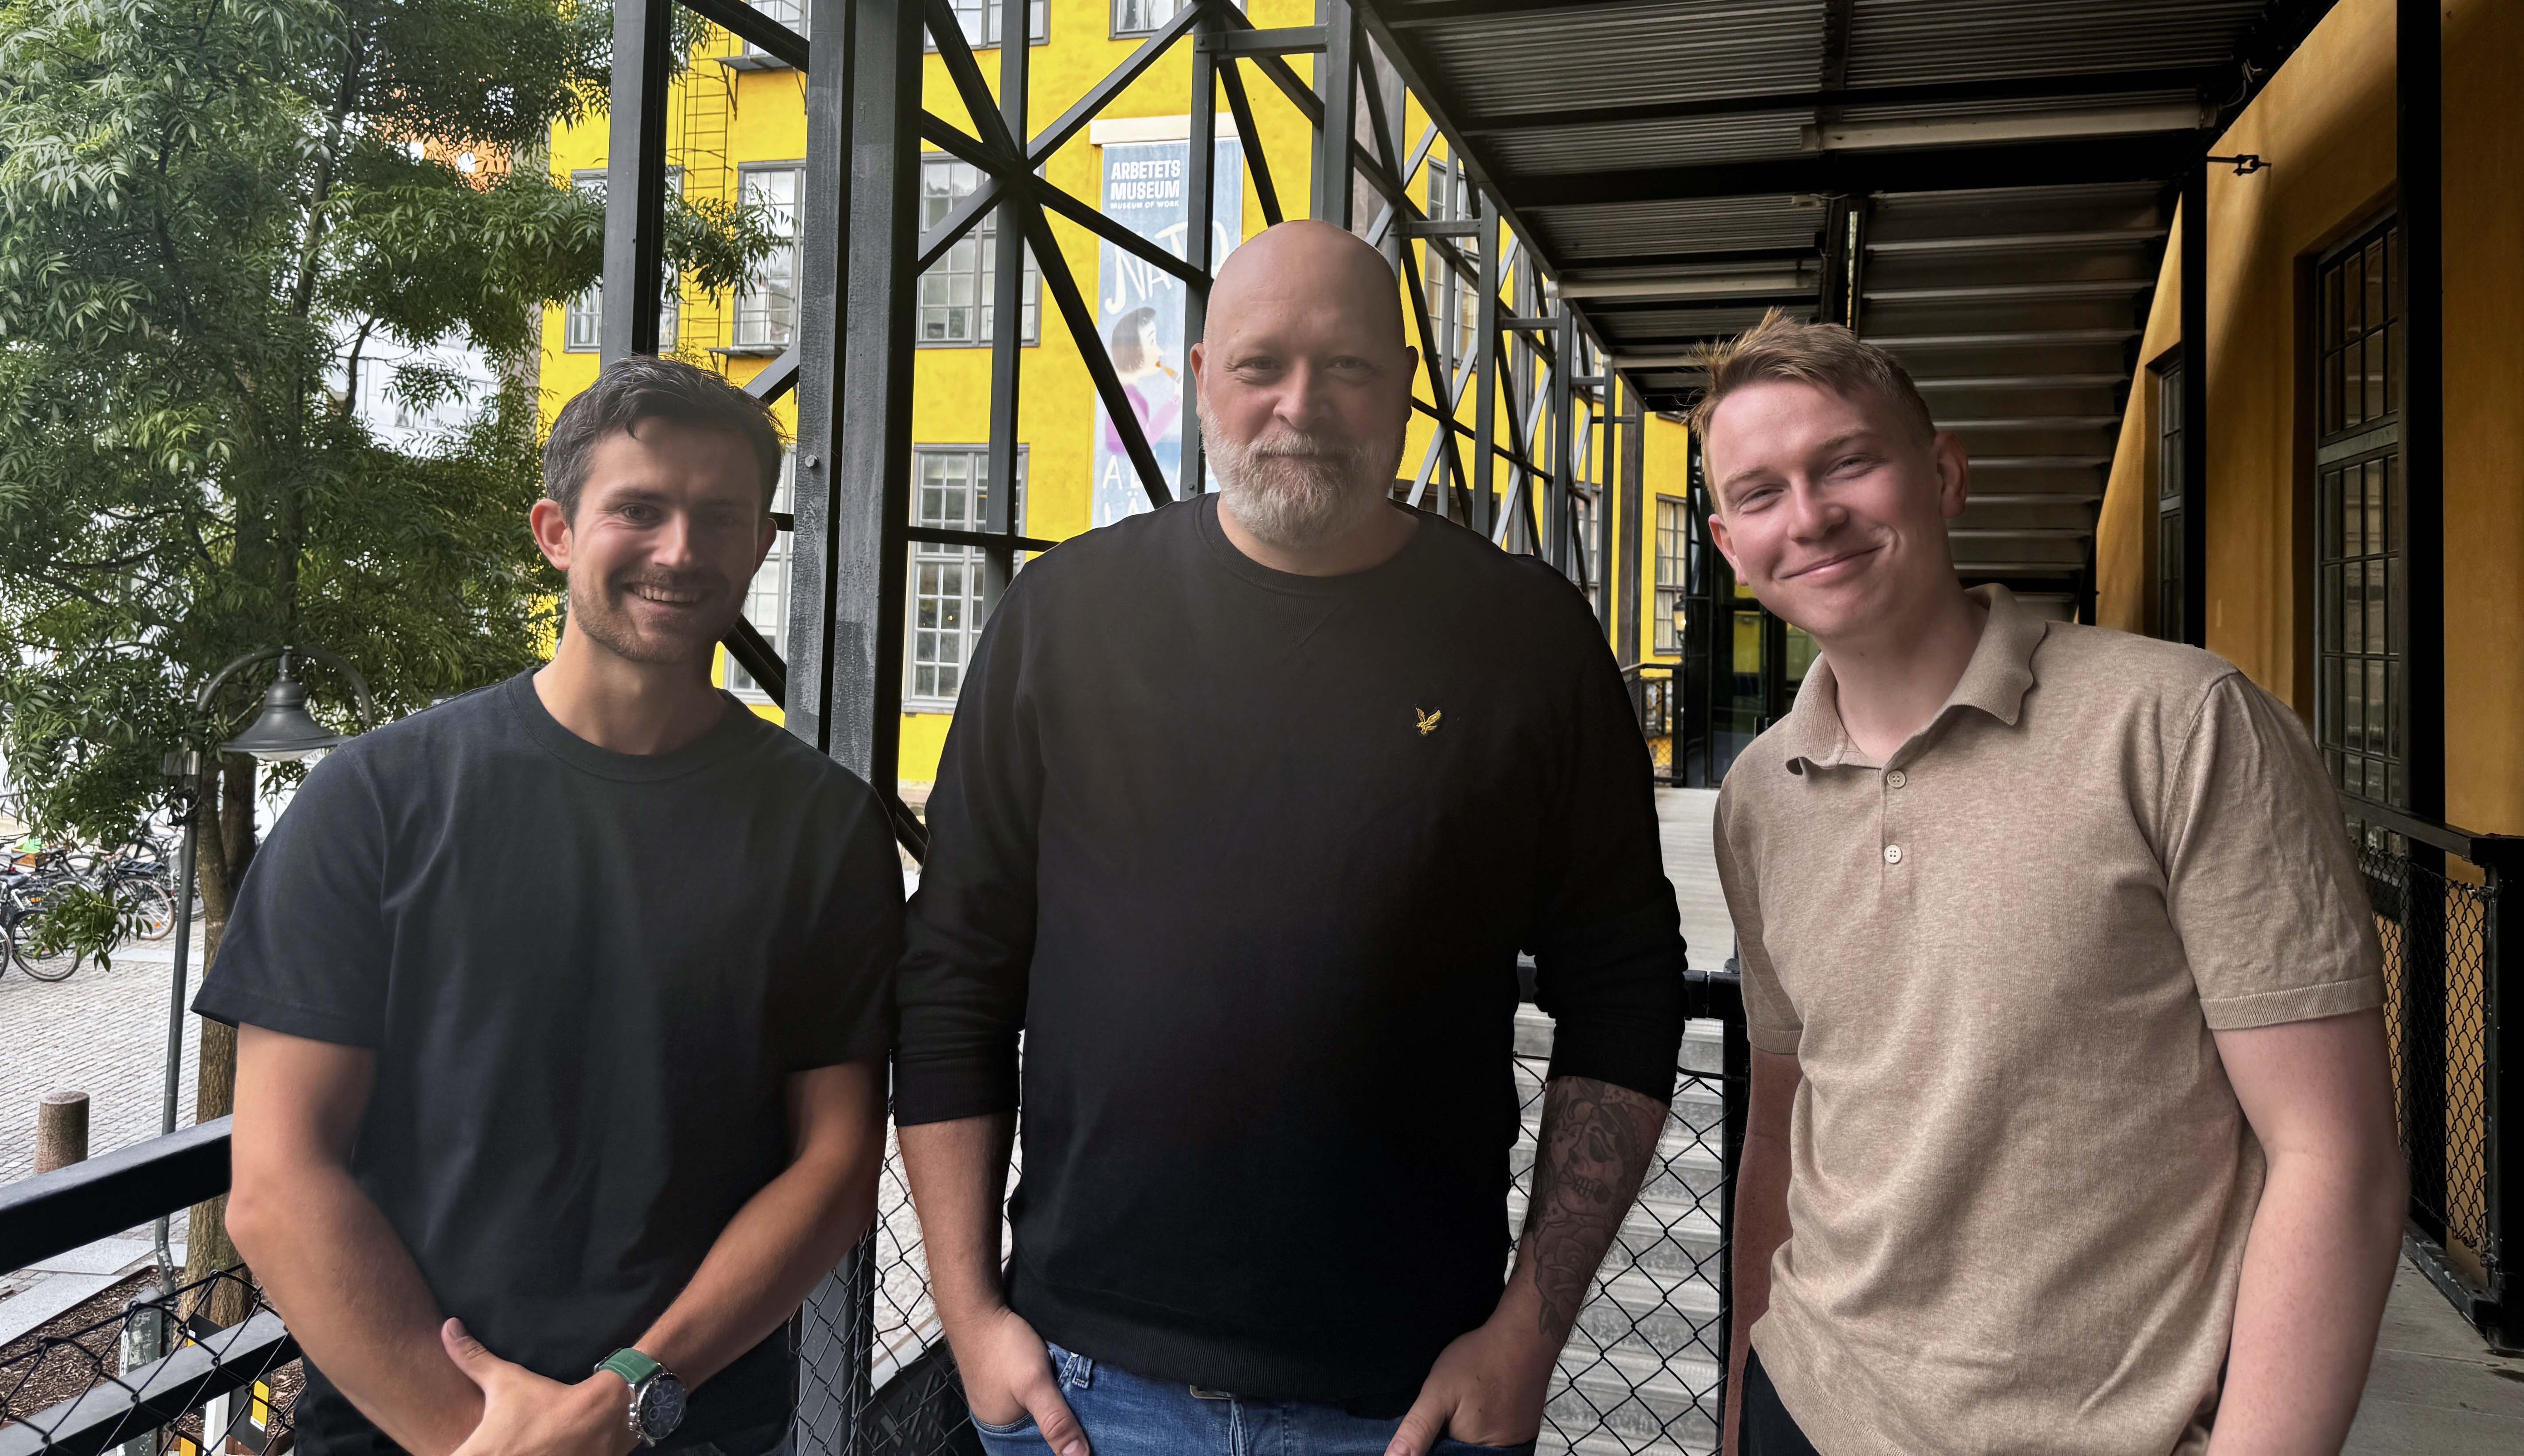
Fredrik Burmester, Johan André and Jacob Andersson, all members of the Sigbit team.
The company, which has its office in Strykbrädan, an environment where Norrköping Science Park facilitates networking with other companies, is currently working on building “My Pages” for Finspångs Tekniska and integrating various business systems, as well as integrating AI functions into both their own systems and customer solutions.
This fall, we will focus on implementing AI language models within Orbit, making it possible to ask deeper questions about the content on the platform. We will also expand support for integrating third-party APIs into the application, concludes Johan André.

Relaterat
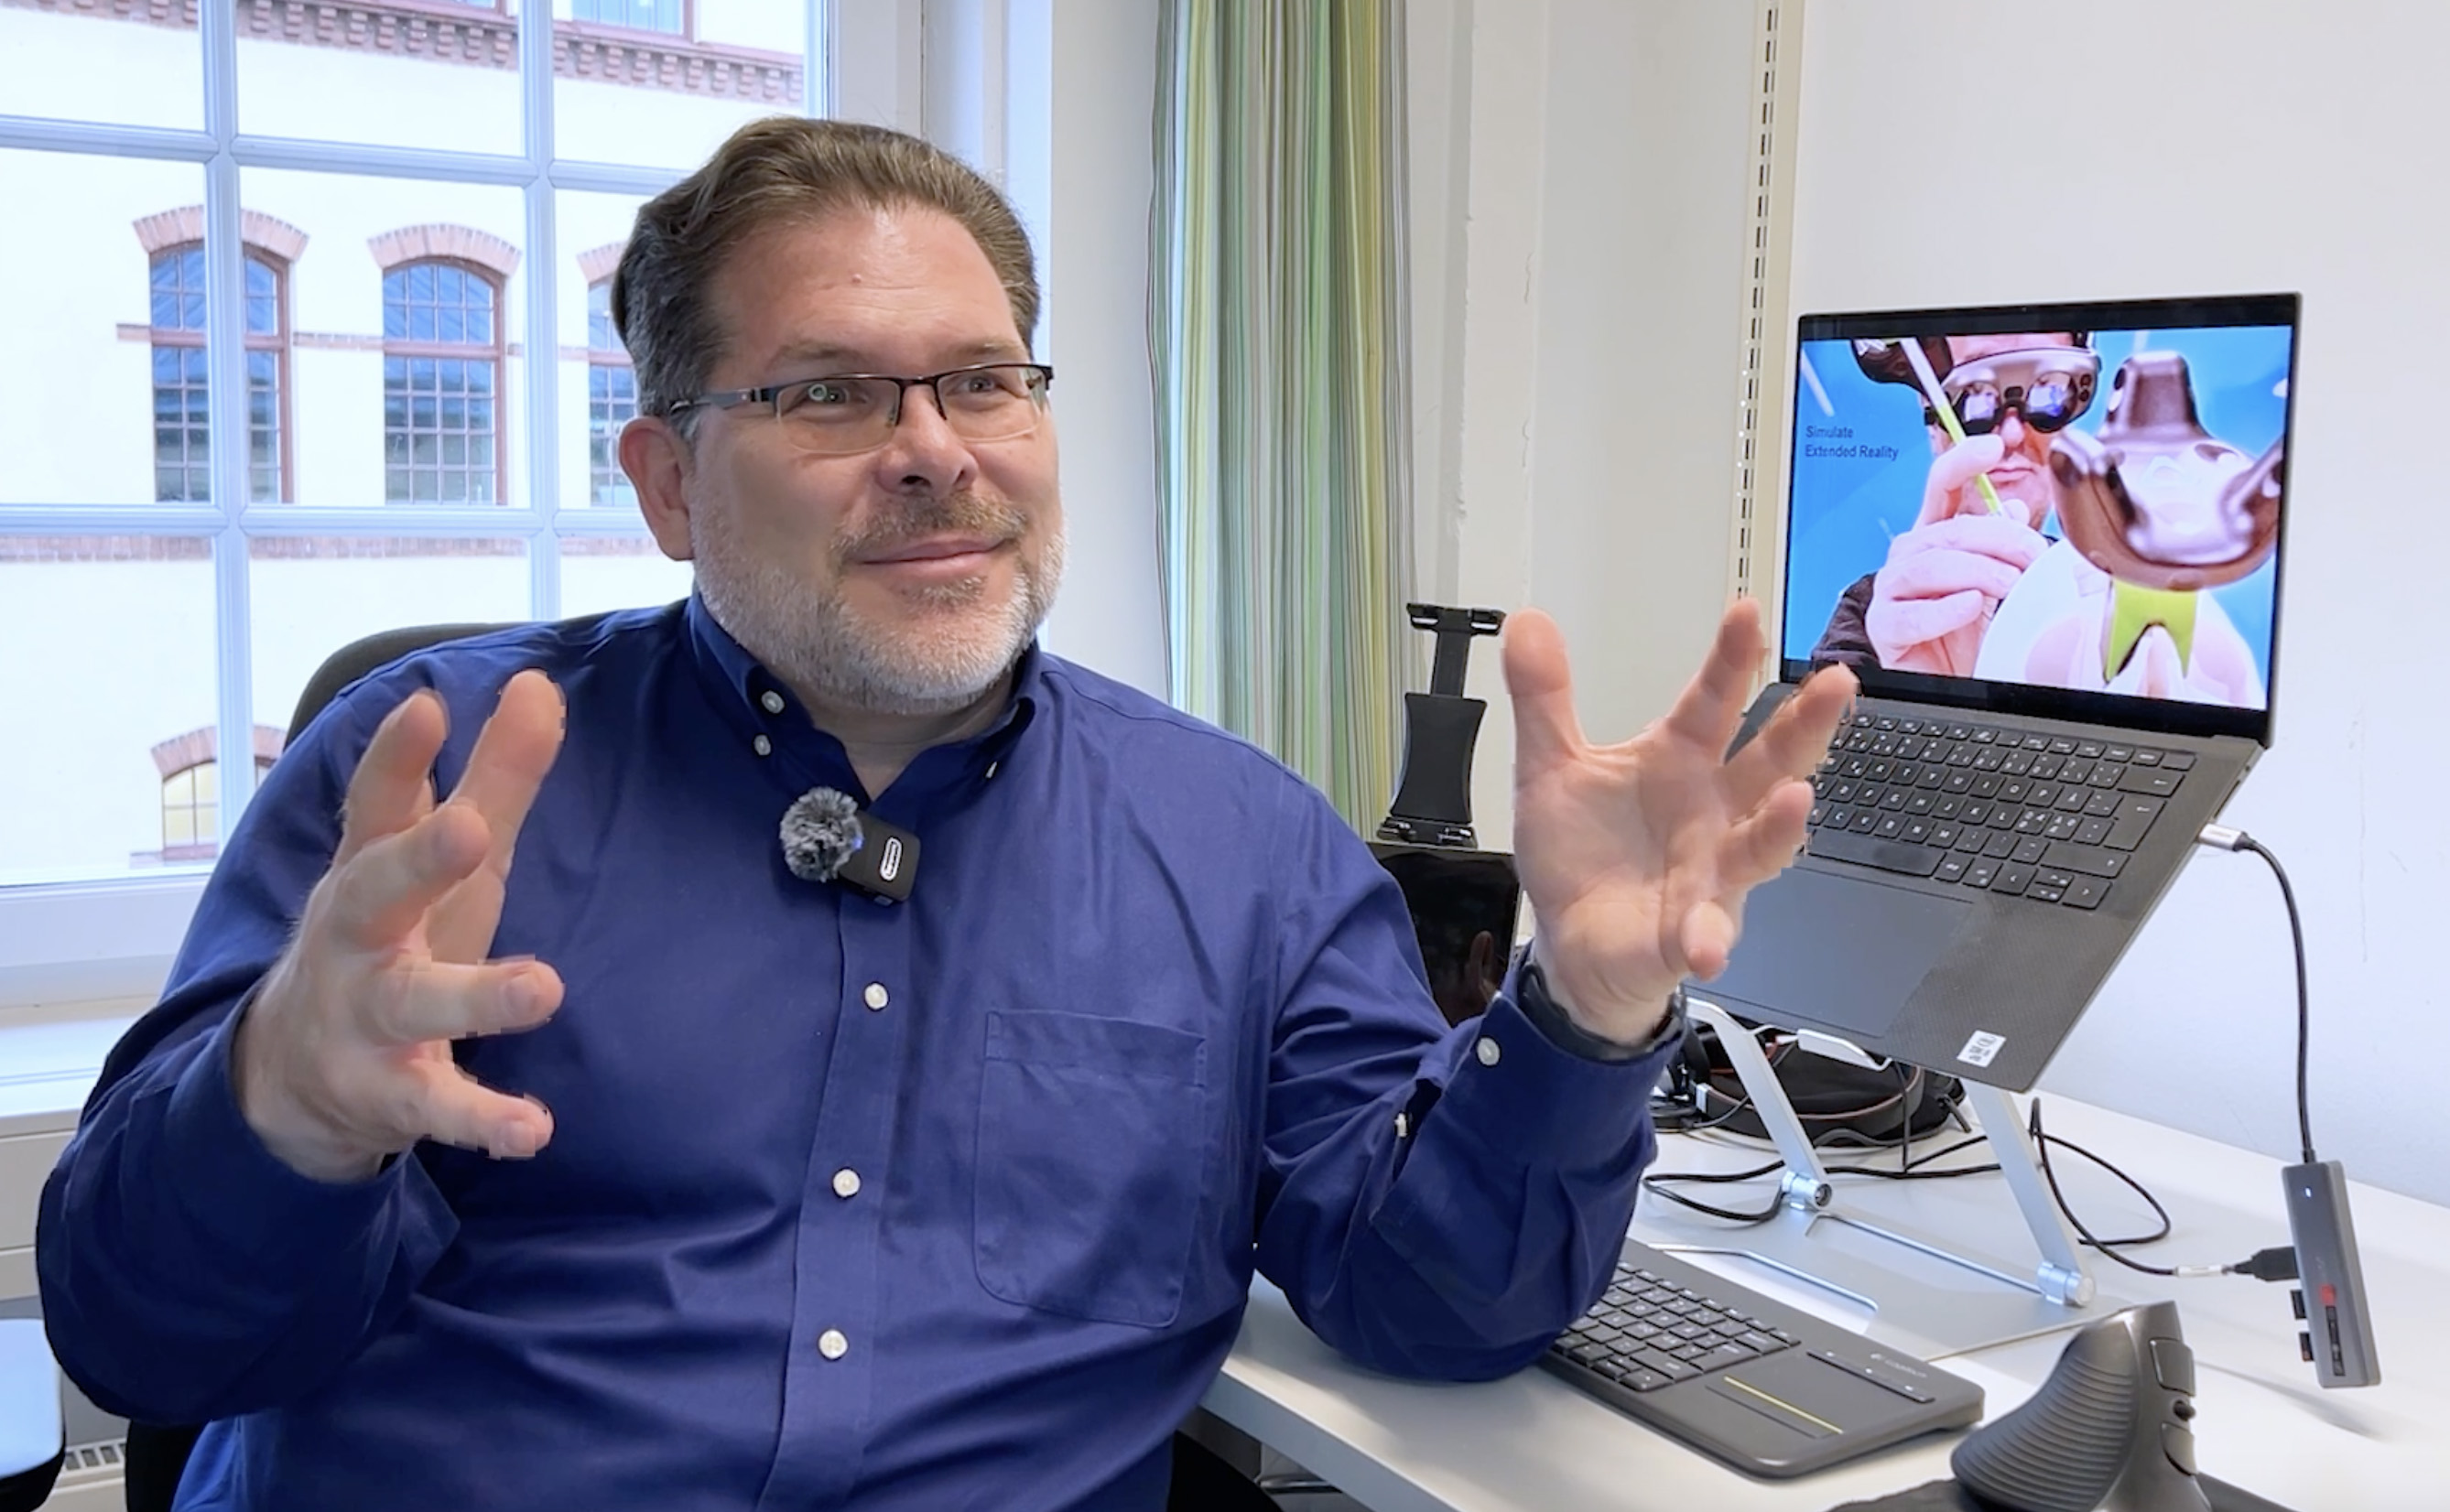
In this film, you will meet Mario Romero, new scientific leader for Visual Sweden and senior associate professor at Linköping University since the beginning of 2025. We discuss Mario's background, his views on areas such as visualization and image analysis, why these are important for Sweden in the future, and much more.
26 Mar 2025
Den 9 maj 2025 skriver den svenska långfilmen UFO Sweden historia när den släpps på biografer i USA som världens första visuellt dubbade långfilm. Med hjälp av nyinspelad engelsk dialog av skådespelarna och AI-justerade läpprörelser har filmen gått från att vara på svenska till att bli en engelskspråkig film. Nu släpps en första titt på “Watch the Skies” som filmen heter på engelska.
21 Mar 2025

Följ NOSP